Snap One is excited to announce improvements to OvrC and the OvrC Pro agent!
Until now, several great troubleshooting tools have only been accessible via the local UI of an OvrC Pro enabled device. With this update, we are now making tracert, terminal emulator for SSH and Telnet, and more, available directly through the OvrC application on mobile and desktop devices. These features allow for in-depth, remote troubleshooting of devices as if the technician was locally connected to the network.
New OvrC Tab: “Pro Tools”
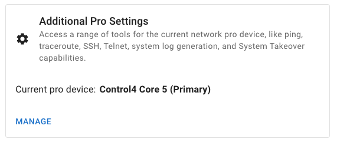
We have consolidated information that is tied to the OvrC Pro agent under a new tab called “Pro Tools” and will show up on the device details of the device that is performing network scans. We have also added a shortcut from the site settings page that takes you directly to the Pro Tools page by clicking on the “MANAGE”. Details follow:
1. Confirm which device is configured as your OvrC Pro agent in Site Settings:
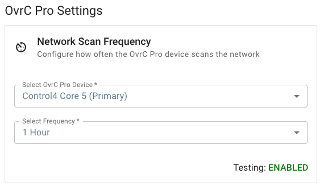
2. Go to that device’s details to access the Pro Tools tab:

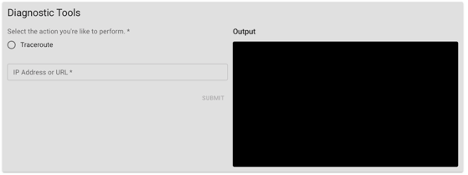
Diagnostic Tools
Trace route, or tracert, is a commonly used troubleshooting tool that technicians use to understand the network and many connectivity issues. With this release, those commands can now be run directly from the OvrC application (web and mobile). Additionally, a terminal emulator has been added for command line entries made over Telnet or SSH. This puts advanced troubleshooting at your fingertips and provides a virtual presence on the network to further reduce truck rolls. These features can be found using the newly added Diagnostics tab on the OvrC Pro enabled device. NOTE: if there are multiple OvrC Pro-capable devices on the project (ex. Araknis router and Control4 CORE controller), this tab is ONLY visible for the device that is configured to perform network scans.
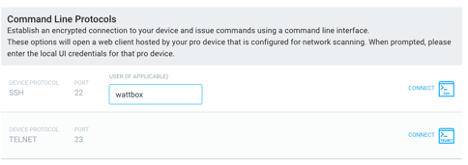
Terminal Emulator
In some cases, there may be a need to open a terminal session to a device on the network. For this, the OvrC Pro Agent has a terminal emulator that uses the OvrC Pro agent as the on-premises device to open a terminal session and connect to a device using telnet (port 23) or SSH (port 22) as these are the most common. This tool is commonly used to interface with non-OvrC enabled devices for tasks like configuring switches that may not have a local UI or configuring the front panel buttons of a PDU.
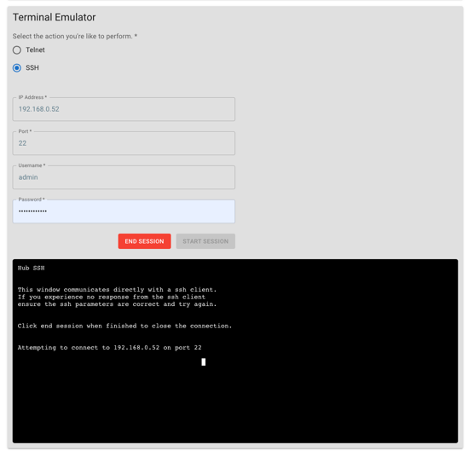
Additionally, this tool will be used for WebConnect sessions that are connecting with Telnet or SSH.
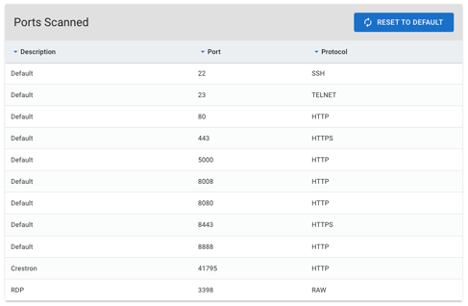
Ports Scanned
The ports scanned by the OvrC Pro agent have been moved under the Pro Tools tab and now only visible on the Pro Agent that is performing the network scans.
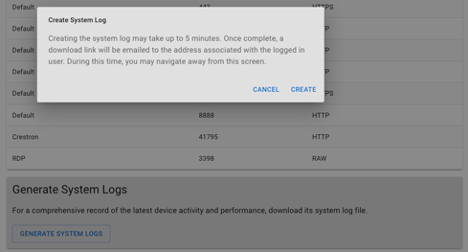
Generating System Logs
There is occasionally the need to pull logs from the OvrC Pro agent at the request of tech support. If logs are requested from the OvrC Pro agent, they can be generated from the Pro Tools tab of the device that is performing the network scans. Because log files can be large and connection speeds vary, the logs will be generated without interruption to the OvrC experience and the user that requested the logs, will be notified via email with a URL where they can be downloaded. This could take up to 5 minutes.
Future Elimination of the Local UI for the OvrC Pro Agent
With these important features moving to the OvrC cloud, access to the local UI of the OvrC Pro agent will no longer be needed and will be removed in a future update to secure the local device and protect the privacy of the customer. For devices like routers and Control4 controllers that are serving as the OvrC Pro agent, this interface was typically found on port 60000 when accessing the device directly. These devices also serve a local UI on port 80 (http) or 443 (https) and there will be no impact to that local interface.
Leave A Reply!